
Did the Covid-19 lockdown really boost bees and wildflowers in Scotland?
Did the Covid-19 lockdown really boost bees and wildflowers in Scotland?
During the lockdown, we came across this fascinating article “Coronavirus may prove boost for UK’s bees and rare wildflowers”. Road verges are a key habitat for wildflowers in the UK, as they are long continuous strips of land typically without trees. In Scotland, about half of all the wildflowers are found on road verges. But when we cut the verge too often or apply weedkillers, as authorities often do, we are limiting the diversity and growth of these wildflowers. It may be the case that the Covid-19 lockdown prevented road maintenance and grass cutting. So while we stayed at home, were the wildflowers going wild and bees having a feast? Is there a way to prove this with science?
We decided to test whether this ‘Bees at Brunch’ hypothesis could be supported by using satellite images over ribbons of invertebrate habitat known as ‘insect corridors’. Buglife, a charity on a mission to conserve bees, butterflies and all other invertebrates, is creating a series of such corridors which they call “B-Lines”. These are designed to restore and link 150,000 hectares of flower-rich invertebrate habitat across the UK: insects need to travel, as well as dine out.
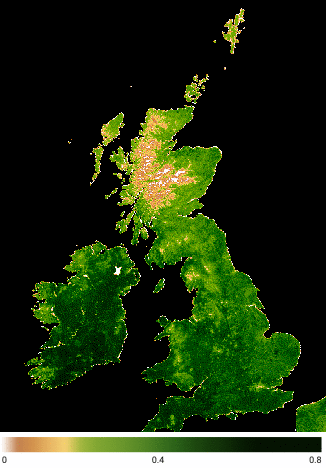
We examined the vegetation along southern Scotland’s B-lines in each month between February and June from 2010 to 2020. We used NASA’s Terra Moderate Resolution Imaging Spectroradiometer (MODIS) Vegetation Indices to do this, and more specifically, the Normalised Difference Vegetation Index (NDVI). NDVI shows the existence and the health of vegetation. The higher the NDVI value is for an individual pixel, the more active and healthy leaves are located within that pixel. Every year in a country like the UK, NDVI rises in the summer and falls in winter, as shown in the right hand figure below. But differences from year to year show changes in plant growth or management – so the question was, can we see these along these B-lines.
|
|
|

The results are shown below – this does seem to have been a good year for vegetation along the B-lines, and thus probably for bees.
|
|
|


The left figure blue lines represent the historical NDVI averages between 2010 and 2019 and the red line is the NDVI value for 2020. It is clear that 2020 had higher than average NDVI values throughout the months, but that includes February and half of the March, before the lockdown started (16 March 2020). What’s intriguing is the jump between March and April. While the NDVI in February 2020 was very high, it declined by 5% in March, bringing the value closer to the 10-year average and way below the historical maximum value (right figure). But in April, the NDVI values reached the highest level in the decade by increasing more than 20%. This drop from February to March is interesting, but is the same in many other years too – we wonder if it’s maybe the result of snow lying on the ground, though filtering the data for snow didn’t change the results much. Anyone have any ideas?
In the following months of May and June, NDVI continued to increase and recorded closer to the maximum historical levels. In June, in any other year of the past decade mean NDVI values typically then falls, perhaps due to heavy roadside maintenance. However in 2020, the vegetation index continued to go up and reached the highest level in the year. Anecdotally, we can see incidences of this lack of maintenance in our home town Edinburgh: the verges on approach to a major roundabout on the main road leading east out of the city now feature grasses so tall that one cannot see the traffic approaching. It is reasonable to imagine that this pattern has been replicated across the countryside.
So it’s probably been a good year for bees, especially after the lockdown in April…
